1. R290 Pressure–Temperature Chart
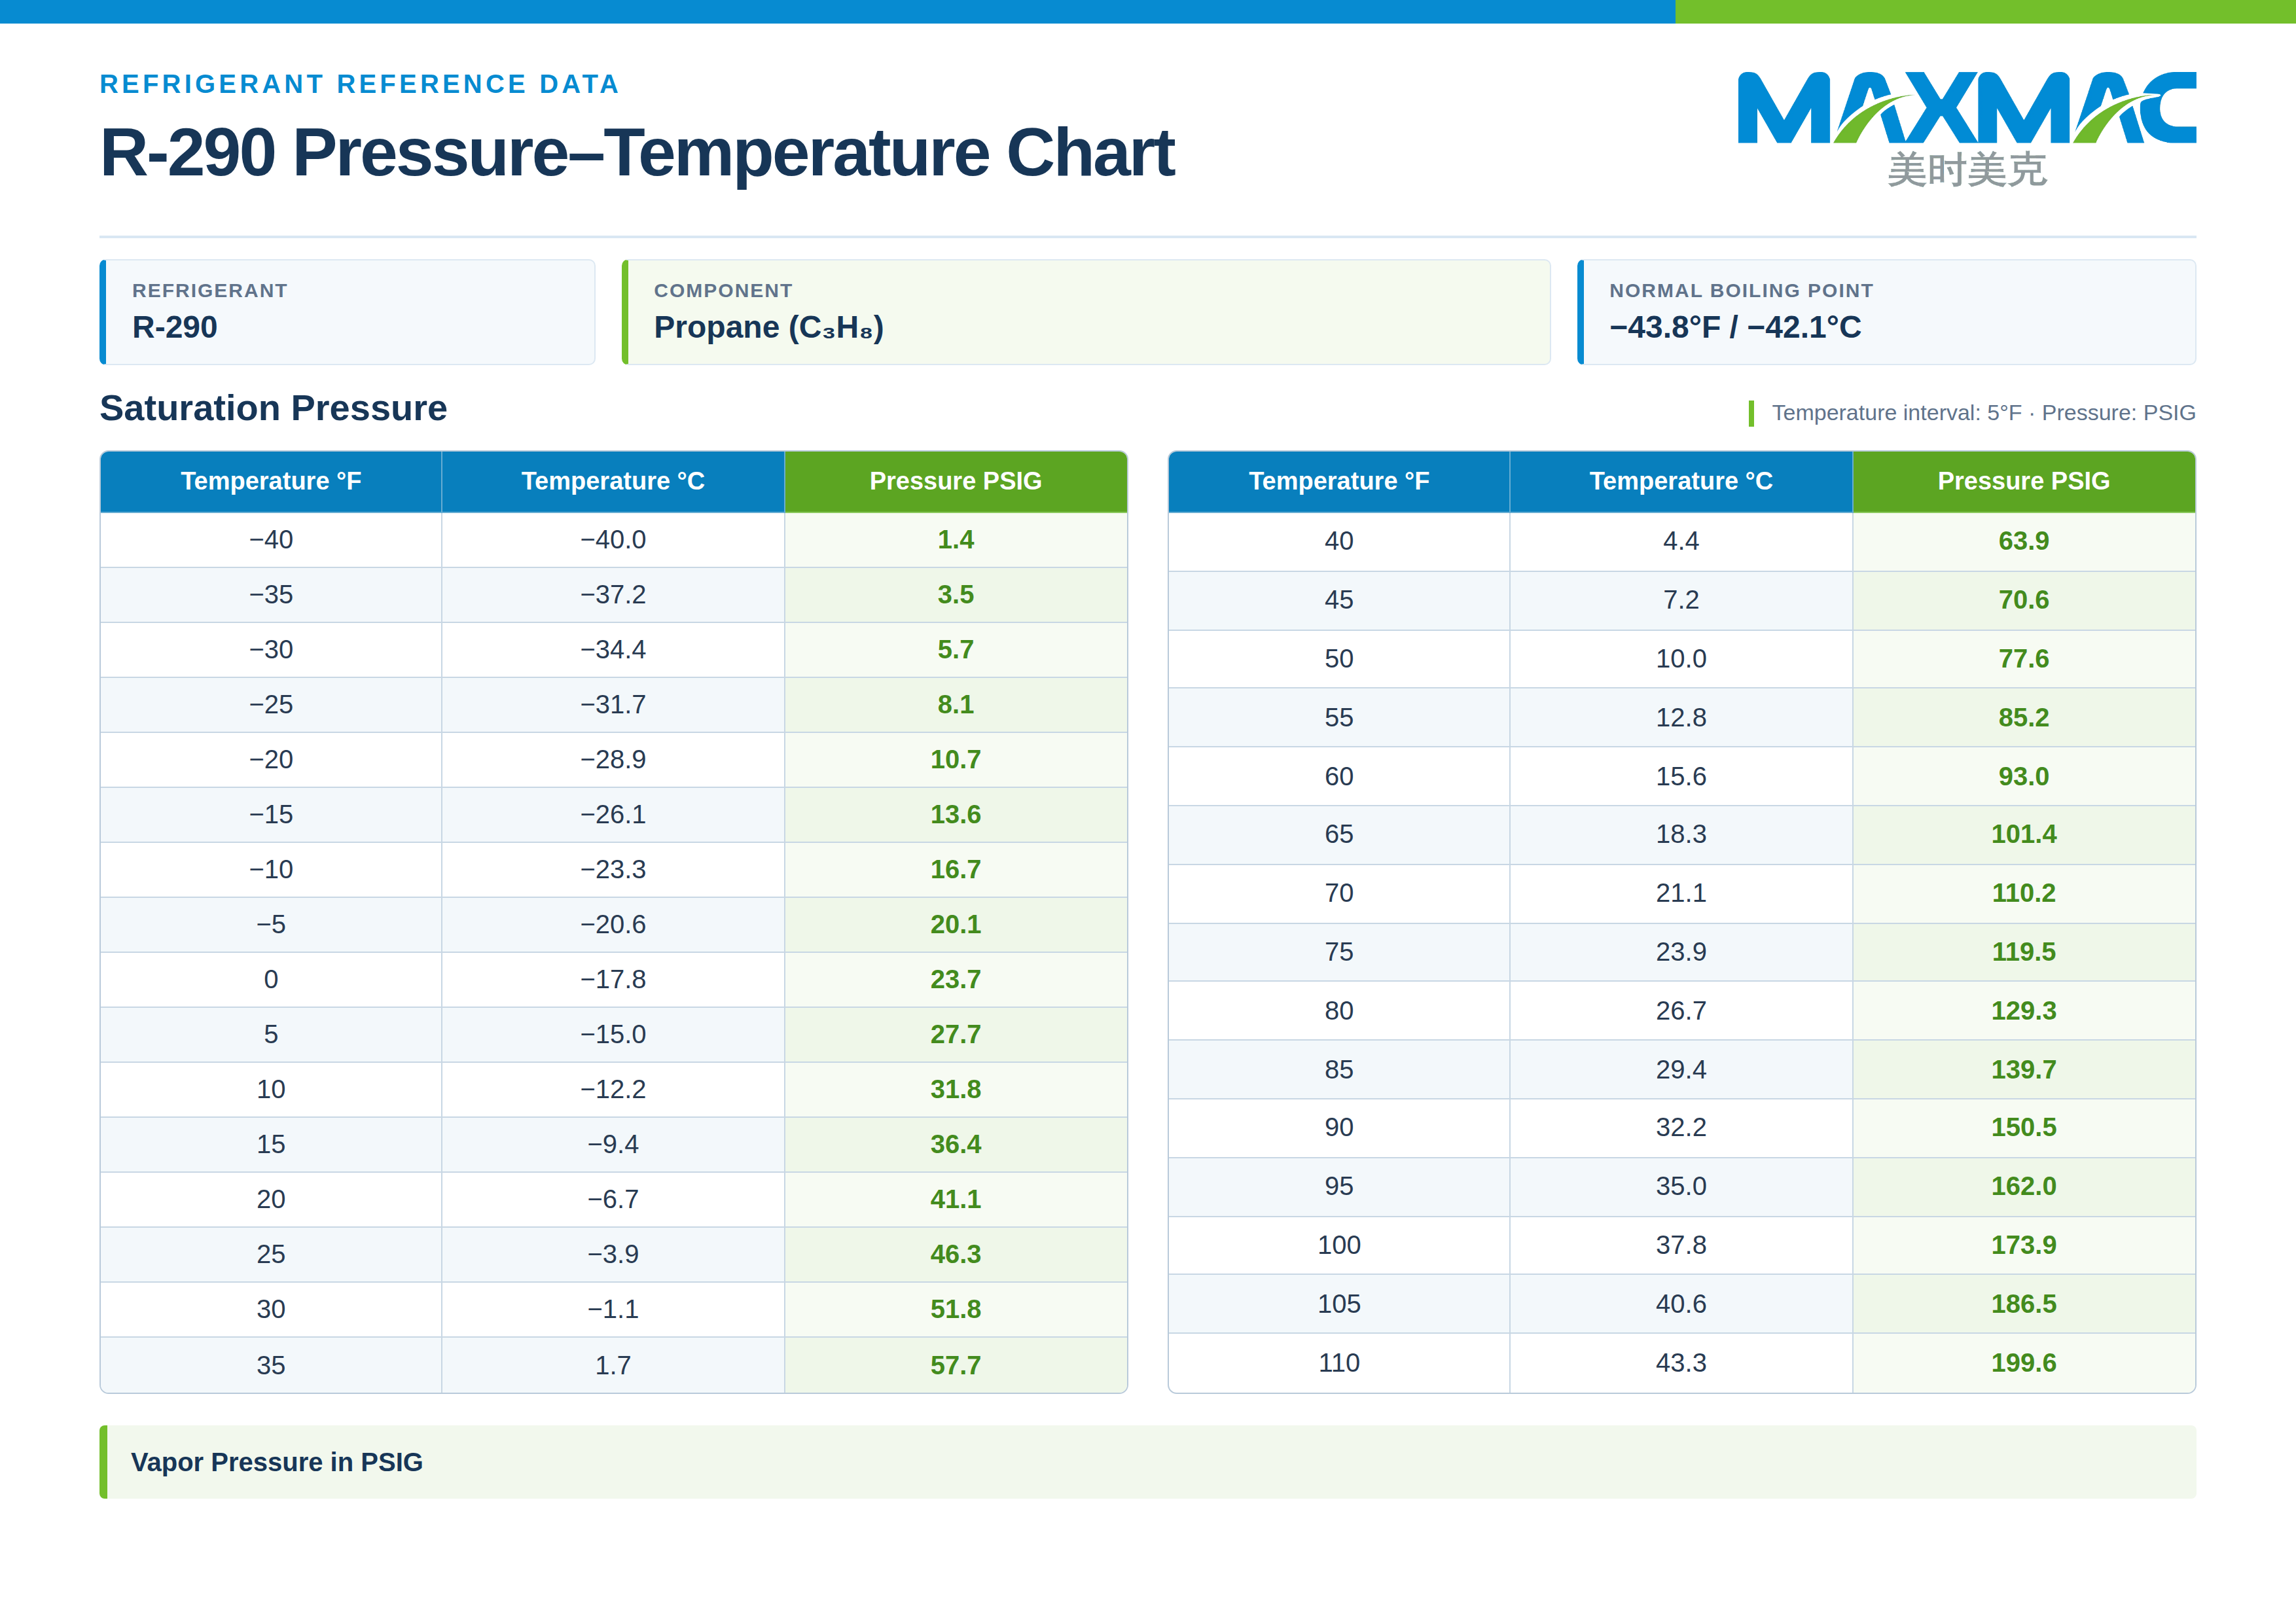
Save a PDF copy of our R290 pressure–temperature chart for easy reference.
The chart lists temperatures in both Fahrenheit and Celsius, alongside the corresponding saturation pressure in PSIG. It covers −40°F to 110°F in 5°F increments. To read it, locate a temperature in either temperature column, then read across to the pressure value in the same row.
For example, at 40°F (4.4°C), the listed saturation pressure is 63.9 PSIG. At 80°F (26.7°C), it rises to 129.3 PSIG.
The values show that saturation pressure increases as temperature rises. This increase is not linear: from 0°F to 40°F, pressure rises by 40.2 PSI, while from 40°F to 80°F, it rises by 65.4 PSI. These figures describe the saturation relationship and should not be presented as a universal operating pressure for every R290 system.
2. R290 Physical Properties and Liquid Density
Refrigerant Composition and Boiling Point
| Refrigerant | Component | Boiling point |
|---|---|---|
| R290 | Propane (>99.5%) | −43.8°F at 1 atm |
Liquid Density by Temperature
| Temperature (°F) | Density (lb/ft³) | Density (lb/gal) |
|---|---|---|
| −80 | 37.7 | 5.0 |
| −40 | 36.2 | 4.8 |
| 0 | 34.5 | 4.6 |
| 40 | 32.6 | 4.4 |
| 80 | 30.6 | 4.1 |
| 120 | 28.1 | 3.8 |
R290 Physical Properties
| Property | Value |
|---|---|
| Environmental classification | Hydrocarbon |
| Molecular weight | 44.11 g/mol |
| Boiling point at 1 atm | −43.8°F |
| Critical pressure | 616 PSIA |
| Critical temperature | 205.8°F |
| Critical density | 13.64 lb/ft³ |
| Vapor density at boiling point | 0.1508 lb/ft³ |
| Heat of vaporization at boiling point | 183.1 BTU/lb |
| Ozone depletion potential | 0 |
| Global warming potential (CO₂ = 1.0) | 5* |
| ASHRAE Standard 34 safety rating | A3 |
Data source: Hudson Technologies R290 reference sheet, page 2.
*GWP is reproduced as listed in the source sheet. Values are updated periodically; refer to EPA or ASHRAE for the latest information.
The physical properties table lists R290’s boiling point at 1 atm, together with a critical temperature of 205.8°F and a critical pressure of 616 PSIA.
Pay attention to the pressure units when reading these references. The pressure–temperature chart uses PSIG, which measures pressure relative to atmospheric pressure. The physical properties table gives critical pressure in PSIA, which measures pressure relative to a vacuum.
The liquid density data shows a decreasing trend as temperature rises. At −40°F, R290’s liquid density is 36.2 lb/ft³. At 120°F, it falls to 28.1 lb/ft³. A fixed volume of liquid R290 therefore contains less mass at the higher listed temperature.
Together, these references show two temperature-related trends: rising saturation pressure and falling liquid density. Check the temperature scale and pressure units whenever using the reference data.