

In 1997–1998, Peru and Ecuador suffered severe flooding while Indonesia, on the other side of the Pacific, faced drought and forest fires. That exceptionally strong El Niño changed rainfall patterns across several regions and showed how shifts in the equatorial ocean could affect everyday life far away. Looking back at those experiences can help us understand the risks posed by the latest event.
A new El Niño is strengthening in 2026. In its September 10 outlook, the US National Oceanic and Atmospheric Administration (NOAA) put the probability of a “very strong” El Niño during the Northern Hemisphere autumn and winter of 2026–2027 at more than 90%. Based on the three-month Relative Oceanic Niño Index, it also estimated a 75% chance of a historic event in October–December 2026 that could exceed the strength of previous events recorded since 1950.[1]
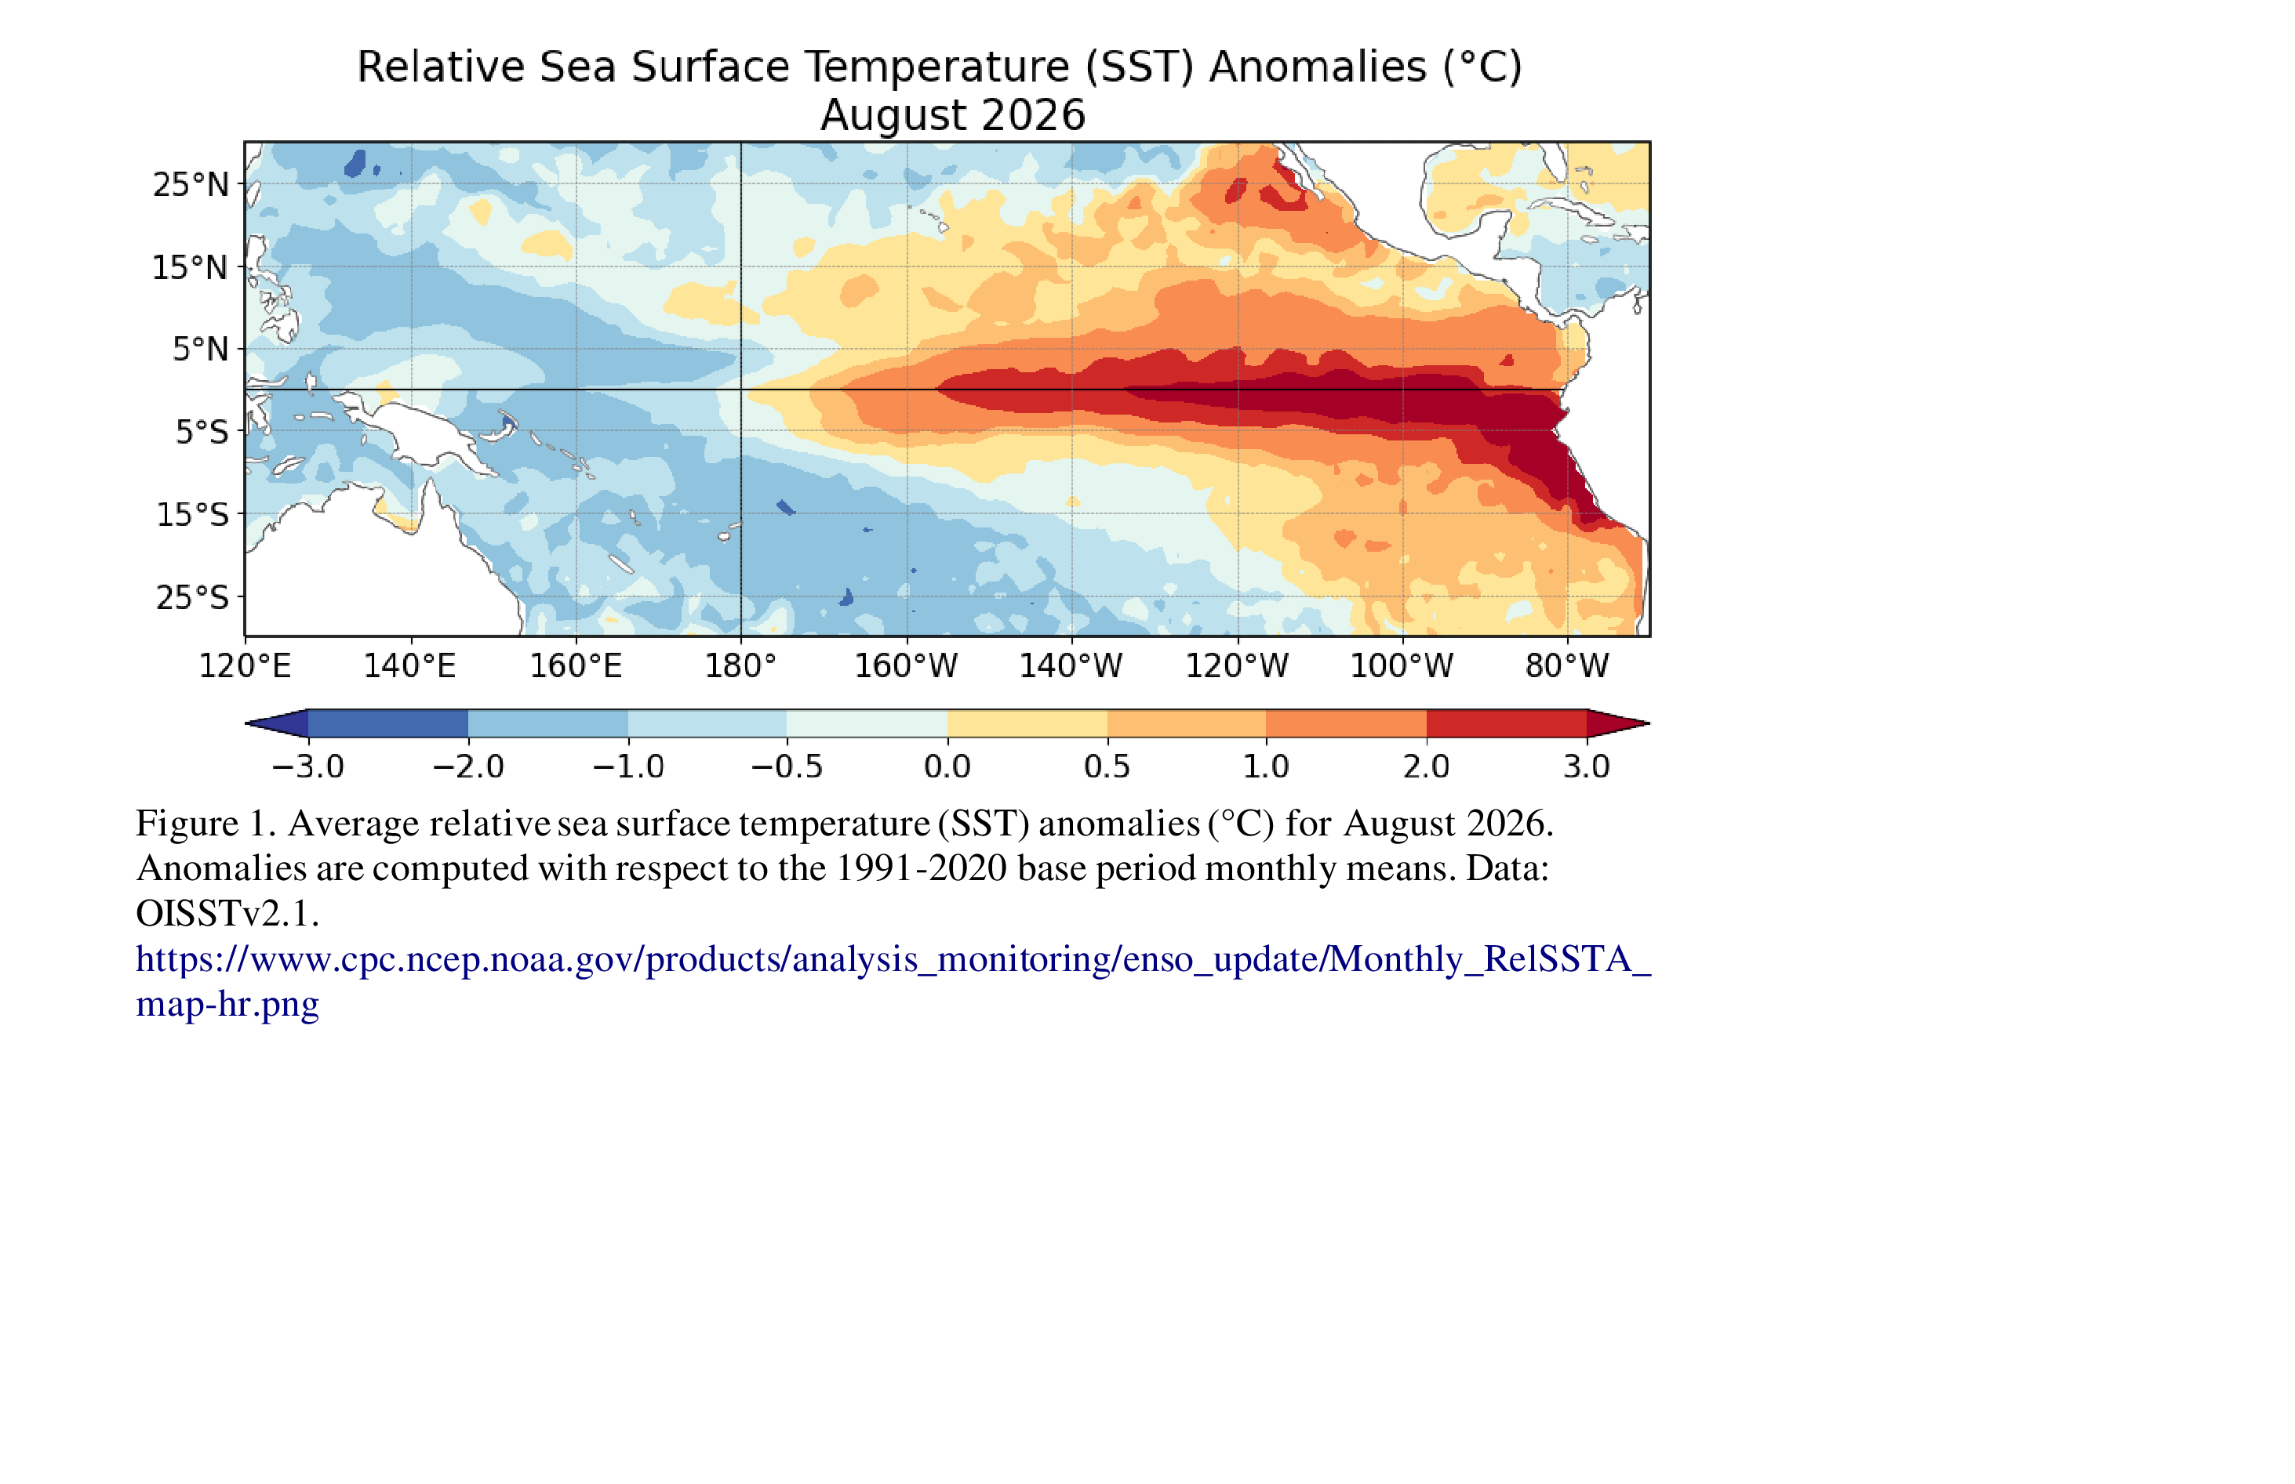
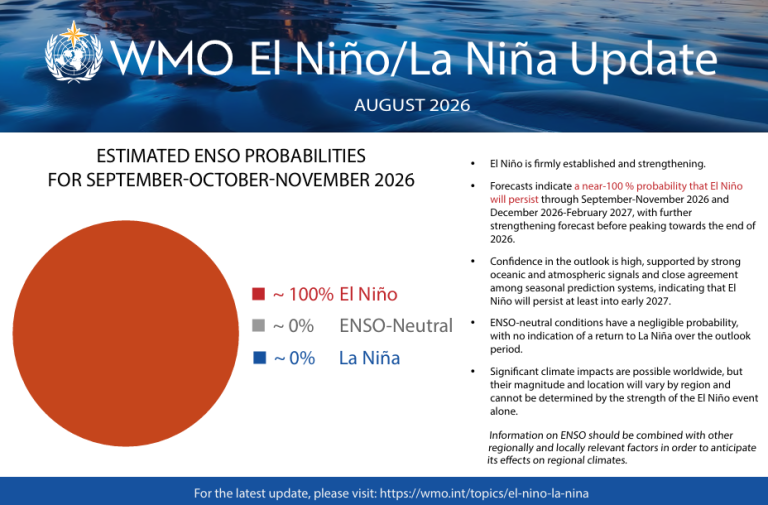
The World Meteorological Organization (WMO) expects the event to peak around the end of 2026, with its effects continuing into 2027. As the ocean and atmosphere evolve over the coming months, communities will need to prepare for possible flooding, drought and extreme heat.[2]
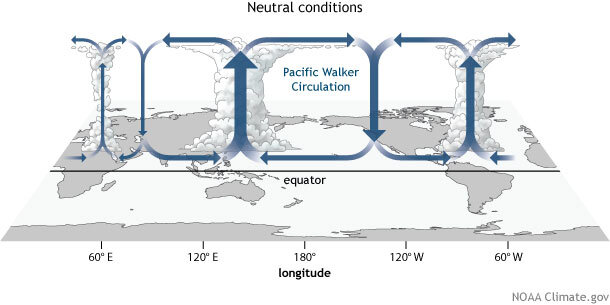
El Niño can affect places so far apart because of the ongoing interaction between ocean water and winds across the Pacific.
Under normal conditions, trade winds near the equator blow from east to west, pushing warm surface water toward Indonesia and Australia. At the same time, colder water rises from below along the South American coast and in the eastern equatorial Pacific, maintaining a marked temperature difference between the two sides of the ocean.
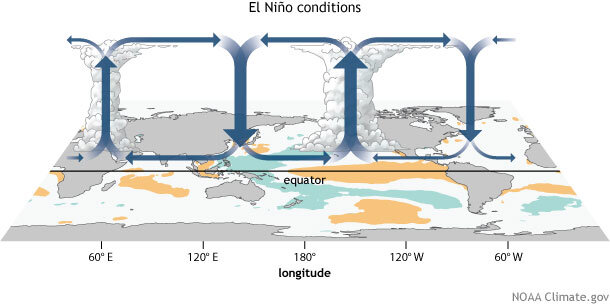
As El Niño develops, the trade winds weaken, warm water spreads into the central and eastern Pacific, and less cold water rises to the surface. These changes in sea temperature shift the areas where clouds and rain form, altering atmospheric circulation. The effects reach thousands of kilometres away, bringing repeated rainfall to some places while leaving others waiting for rain.[3]
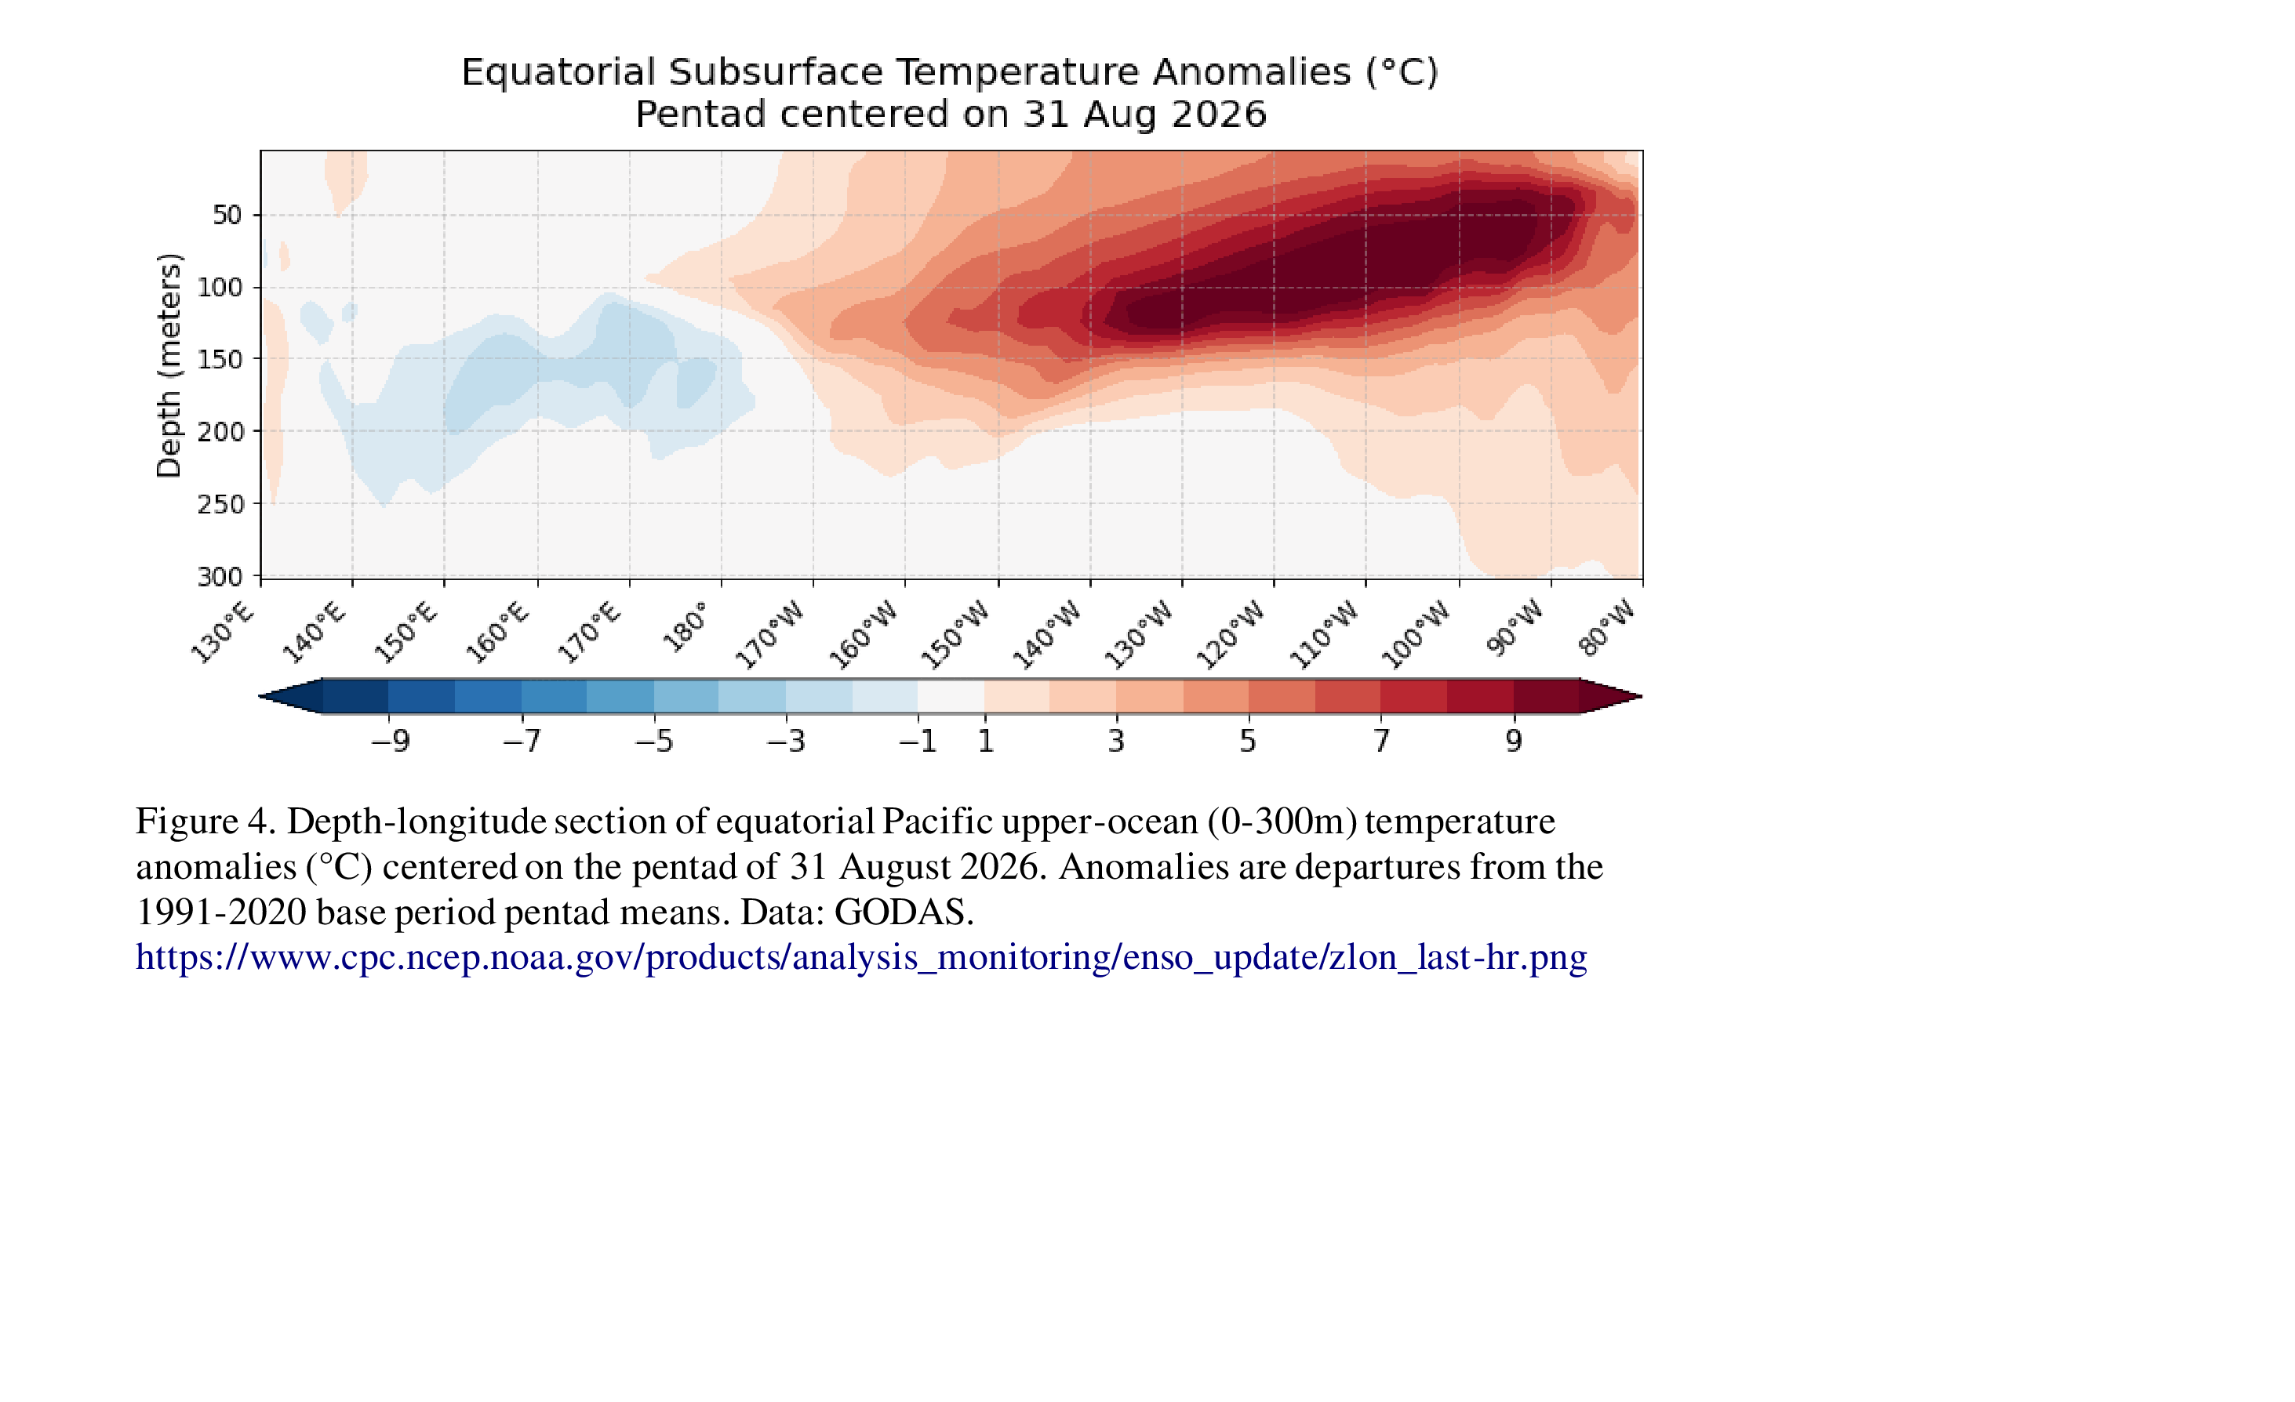
One important factor supporting the continued strengthening of this event is the substantial warmth that has already built up beneath the ocean surface. According to WMO, subsurface water temperatures in some areas were more than 8°C above normal from July to early August 2026, providing conditions for El Niño to develop further.[4]
The interaction between the ocean and atmosphere reinforces this process. Weaker trade winds allow the central and eastern Pacific to warm more easily, and the warmer water further changes convection and winds above it. NOAA’s latest observations show unusual wind patterns across the equatorial Pacific, increased rainfall in the central and eastern Pacific, and suppressed convection near Indonesia.[1]
These changes are taking place in a warmer climate than in the past. Long-term warming combined with El Niño makes extreme heat and heatwaves a particular concern. Sea temperatures in the Indian and Atlantic oceans, together with regional atmospheric circulation, also influence how the weather develops.[5]
During previous strong El Niño events, South America, Southeast Asia and southern Africa have all experienced serious disasters. Some effects emerged while the events were still developing and continued into later seasons.
In early 1998, northwestern Peru and western Ecuador experienced unusually heavy rainfall. NOAA’s climate assessment for that year documented significant flooding and mudslides in both areas. Bordering the eastern equatorial Pacific, these regions saw El Niño’s shifts in rainfall directly affect life along the coast.[6]
For local residents, repeated rainfall was especially difficult to cope with. More rain arrived before floodwaters had receded, while mudslides in mountainous areas made travel and rescue efforts harder. The experience of 1997–1998 remains an important reason for communities along South America’s Pacific coast to pay attention to El Niño risks.[6]
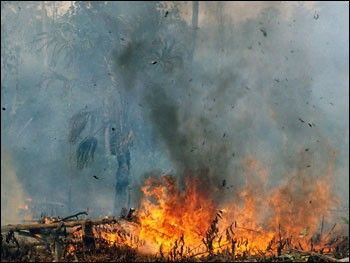
At the same time, Indonesia was facing a prolonged lack of rain. In the second half of 1997, drought left large areas of forest vulnerable to fire. Some fires used to clear farmland and open up land escaped control in the exceptionally dry conditions, spreading across parts of Sumatra and Kalimantan.[7]
NASA’s account of the disaster describes forest fires continuing from late 1997 into early 1998. Thick smoke covered large parts of Indonesia, and satellite images from the time captured haze spreading across the islands.[7]
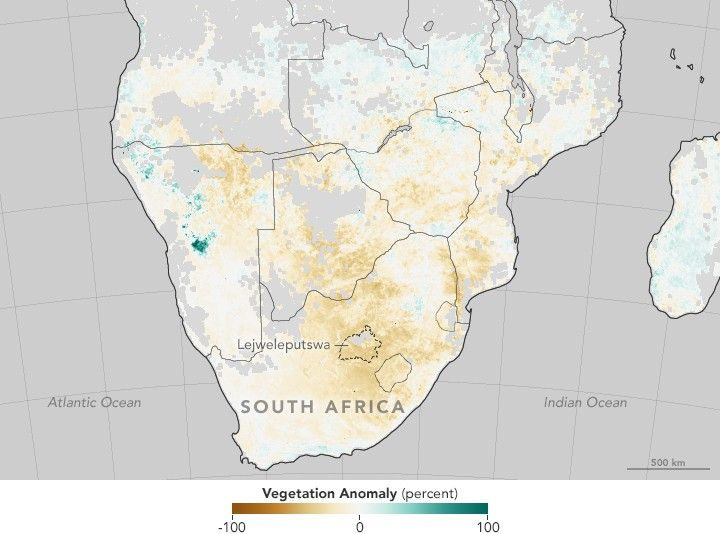
In 2015–2016, another strong El Niño worsened drought across southern Africa. Countries including South Africa, Zimbabwe and Mozambique received little rain during what should have been their rainy season. NOAA reported that parts of central and southern Mozambique, Zimbabwe and central South Africa received less than half their normal rainfall, affecting crops and local water supplies.[8]
The effects of the drought lasted for months. In August 2016, satellite comparisons published by NASA showed that water levels in Mozambique’s Cahora Bassa reservoir had fallen substantially since 2014, exposing sediments along the shoreline. The reservoir operator also announced reduced power generation because of insufficient rainfall that year. These experiences show how changes during a rainy season can affect agriculture and electricity supplies long afterwards.[9]
As the current El Niño continues to develop, the risks facing different regions are receiving growing attention.
Some places will need to cope with too much rain. Repeated downpours can cause rivers to overflow and streets to flood, and can trigger flash floods and landslides in mountainous areas. In its updates on the current event, WMO has already highlighted measures Peru has taken to prepare for flooding and landslides.[4]
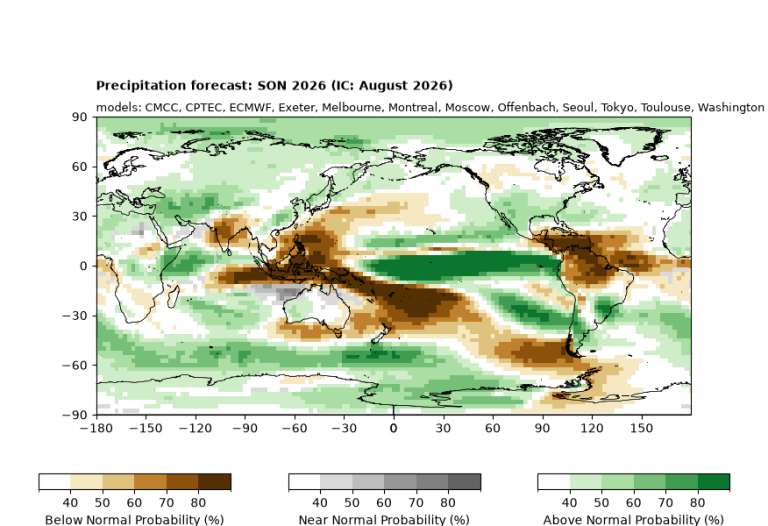
Other places may face long stretches with little rain. As drought persists, soils dry out and pressure grows on reservoirs and agricultural water supplies. Central and eastern Australia often receive below-average rainfall in winter and spring during El Niño years. When a long dry spell coincides with hot weather, vegetation becomes easier to ignite and wildfires become harder to manage. Smoke can also travel with the wind, affecting air quality in distant communities.[5][10]
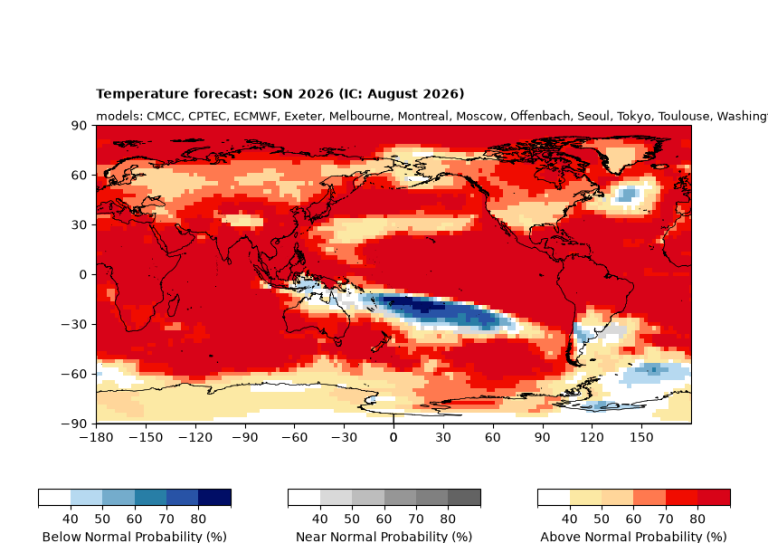
Extreme heat also deserves attention. WMO’s seasonal outlook for September–November 2026 indicates an increased likelihood of above-normal temperatures across most of the world’s land areas. Prolonged hot weather makes outdoor work more demanding, increases household cooling needs and puts greater pressure on public services.[2]
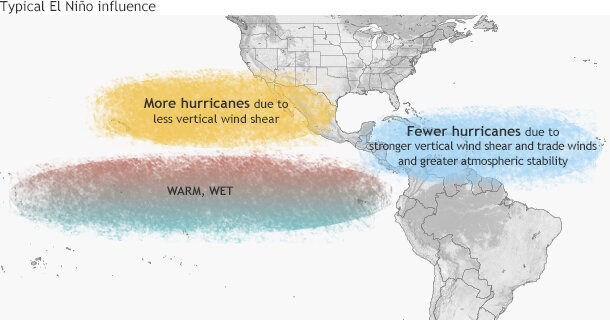
Changes in ocean conditions and wind patterns also influence tropical cyclones. El Niño generally favours hurricane activity in the central and eastern Pacific, while suppressing Atlantic hurricane activity through mechanisms such as increased vertical wind shear. For coastal communities, regional seasonal outlooks and individual cyclone warnings provide essential information for planning work and daily life.[3]
MAXMAC encourages everyone to keep an eye on changing weather in the months ahead, stay alert to potential natural disasters, and take precautions in advance based on local warnings.
References
Sources and images accessed on September 18, 2026. Images are screenshots from the original materials, with credits beneath each figure.
- NOAA: September 2026 ENSO Diagnostic Discussion
- WMO: El Niño Outlook and Extreme Weather Risks into 2027
- NOAA: El Niño and La Niña Frequently Asked Questions
- WMO: Monitoring and Responding to the Current El Niño
- Australian Bureau of Meteorology: What El Niño Means for the Climate
- NOAA: Climate Assessment for 1998 — Floods and Mudslides in Peru, Ecuador and Other Regions
- NASA Earth Observatory: Drought and Forest Fires in Indonesia, 1997–1998
- NOAA: Rainy-Season Drought in Southern Africa, 2015–2016
- NASA Earth Observatory: Falling Water Levels at Mozambique’s Cahora Bassa Reservoir in 2016
- Australian Bureau of Meteorology: El Niño, Drought and Fire Risk
- NASA Earth Observatory: Drought and Vegetation Anomalies in Southern Africa